
- Academic Editor
Background: Magnetoencephalography (MEG) is a non-invasive imaging technique for directly measuring the external magnetic field generated from synchronously activated pyramidal neurons in the brain. The optically pumped magnetometer (OPM) is known for its less expensive, non-cryogenic, movable and user-friendly custom-design provides the potential for a change in functional neuroimaging based on MEG. Methods: An array of OPMs covering the opposite sides of a subject’s head is placed inside a magnetically shielded room (MSR) and responses evoked from the auditory cortices are measured. Results: High signal-to-noise ratio auditory evoked response fields (AEFs) were detected by a wearable OPM-MEG system in a MSR, for which a flexible helmet was specially designed to minimize the sensor-to-head distance, along with a set of bi-planar coils developed for background field and gradient nulling. Neuronal current sources activated in AEF experiments were localized and the auditory cortices showed the highest activities. Performance of the hybrid optically pumped magnetometer-magnetoencephalography/electroencephalography (OPM-MEG/EEG) system was also assessed. Conclusions: The multi-channel OPM-MEG system performs well in a custom built MSR equipped with bi-planar coils and detects human AEFs with a flexible helmet. Moreover, the similarities and differences of auditory evoked potentials (AEPs) and AEFs are discussed, while the operation of OPM-MEG sensors in conjunction with EEG electrodes provides an encouraging combination for the exploration of hybrid OPM-MEG/EEG systems.
Functional neuroimaging, like magnetic resonance imaging (MRI), has long been restricted to both static position and static experimental tasks owing to the size, complexity and weight of neuroimaging measurement instruments. Such restrictions not only limit the scope of experiments [1, 2, 3], but also make them unsuitable for children, babies and subjects with reduced mobility. Thus, there is a strong demand for the acquisition of brain activity data using a wearable system that both enables free movement in various experimental environments and accommodates different head shapes and sizes.
Electroencephalography (EEG) system and functional near-infrared spectroscopy (fNIRS) system are the most common technologies among the wearable non-invasive functional neuroimaging. fNIRS has lower temporal resolution and shallower data acquisition from cortical regions when compared with EEG [4]. Yet EEG, which measures electrical potentials evoked by neural current flow [5] on the scalp surface, is subject to artifacts caused by muscle activities [6] and the inhomogeneous conductivity profile of the head results in electrical potentials that are reduced in amplitude and spatially distorted at the scalp surface [7, 8, 9]. Magnetoencephalography (MEG) [10], a non-invasive technique that permits straight measurement, records human neuro-magnetic fields at both high spatial and temporal resolutions, induced by the same synchronized ionic neural currents detected as the EEG signal. Superconducting quantum interference devices (SQUID), widely used for MEG measurement, have demonstrated great value in clinical and scientific research areas, such as epilepsy [11], aging problems [12], cognitive research [13] and developmental studies [14], from the fetus to old age [15, 16]. Optically pumped magnetometers (OPMs) are a promising device for the development of MEG measurement that can individually be operated in a room-temperature environment and meet the fundamental technical requirements in the development of wearable neuroimaging for weight, brain coverage and sensitivity [17]. Moreover, the small size, light and wearable characteristics of OPMs facilitate their combination with other modalities, such as fNIRS or EEG in the same measurement system.
Many experiments about properties of human auditory responses using OPM sensors have been undertaken. Johnson et al. [18] employed a twin rubidium spin exchange-relaxation-free magnetometer system to record auditory evoked response fields (AEFs). Labyt et al. [19] presented the first proof of concept confirming the possibility of detection of AEF MEG signals with OPM sensors and found no obvious difference in AEF latency between commercial SQUID and OPM. Borna et al. [20, 21] conducted AEF experiments with a system that consisted of an array of 20 OPM channels in a person-sized magnetic shield environment and cross-validated the robustness of the system by comparing the equivalent current dipole locations of the OPM-MEG and generic SQUID MEG systems. Marhl et al. [22, 23] reported AEF measurements with a 15-channel OPM-MEG system and compared the OPM results to those obtained with the SQUID system. Zhang et al. [24] observed clear AEFs in an unshielded OPM-MEG system. Seymour et al. [25] recorded AEFs in subjects that made large natural head movements continuously throughout the recording. An et al. [26] and Jazbinšek et al. [27] detected auditory-related brain responses in a two-layer magnetically shielded room. Iivanainen et al. [28] quantified the performance of a 24-channel OPM-MEG system in classification of single-trial evoked responses. Wang et al. [29] proposed an automatic optimization method for the signal-space separation parameters for an OPM sensor array with auditory-evoked component that can be located in the temporal cortex. Meanwhile, Ru et al. [30] conducted AEF experiments to demonstrate the feasibility and robustness of a MEG-EEG-fNIRS acquisition system in a cylindrical magnetic shield. Boto et al. [1] combined and compared EEG and OPM-MEG measurements by motor task and visual task and found that OPMs could be used in conjunction with conventional EEG electrodes to develop hybrid MEG/EEG systems. The comparison results also showed that the neural signals measured by an OPM-MEG system are less affected by movement artefacts and have better spatial specificity than those measured by an EEG system.
In this paper, a 15-channel wearable OPM-MEG system was constructed and high-quality AEFs were acquired inside a custom-built magnetically shielded room (MSR) equipped with a set of bi-planar coils to null remnant background magnetic fields. Results verified the possibility of implementing MEG measurement under natural movement states of subjects via field nulling system. The co-registration process of aligning sensor coordinates with the magnetic resonance (MR) image coordinates is also reported. This corrected the error arising from head movements and is applicable without additional setup in most helmet systems mentioned in previous publications about OPMs. Neuronal responses for AEF experiments were localized at M100 peaks by linearly constrained minimum variance (LCMV). Localization results showed the promise of using a limited number of OPM sensors for source localization. Moreover, auditory evoked responses were measured by a hybrid MEG/EEG system and the differences in electromagnetic signals were compared. Results about the complementarity of the two modalities provided some basis for the construction of hybrid systems.
The OPM-MEG system consists of 15 channel commercial OPM sensors (Gen-2.0 QZFM, QuSpin Inc., Louisville, CO, USA), mounted on a flexible helmet adaptable for different subjects. The flexible helmet is based on a ‘headphones-style’ cap and made from an elasticized plastic belt the length of which can be adjusted by a device near the ears that can be extended to adapt to any head shape with little difficulty (Fig. 1B). Movable 3D-printed sensor mounts on the belt easily adjust the sensor’s placement. Any sliding caused by quick subject movements was controlled by each of the sensor mounts which were specially designed with four fixed points under the base that are tightly fixed between the scalp and hair by the pressure of the belt.
 Fig. 1.
Setting of the OPM-MEG system. (A) Schematic illustration of the system. (B) Flexible MEG helmet. (C) Magnetically shielded room and external working environment. MSR, magnetically shielded room; DAQ, data acquisition; OPM, optically pumped magnetometer; MEG, magnetoencephalography.
The system, built specifically for OPM operation, is operated in a custom made MSR (Fig. 1C). A set of bi-planar coils were further developed to decrease any remnant field in the case of slight subject movement. This was achieved by four reference OPM sensors adjacent to the subject that were used to provide feedback for the shimming algorithm. Combing with MSR and bi-planar coils, the background static magnetic field of MSR was decreased to approximately 2nT, with remnant field gradients of less than 6 nT/m in the 30 cm cube center area.
A schematic illustration of the 15-channel OPM-MEG system is given in Fig. 1A. The background field and gradients were firstly nulled via a set of bi-planar coils by calculation of the shimming algorithm. The bi-planar coils and OPMs control, data acquisition and stimulus trigger synchronization were carried out with a custom written C++ based control system. This system ensures synchronization between data acquisition and the stimulus sequence.
Finally, during the recording subjects were required to sit motionless on a non-magnetic plastic armchair placed in the optimal region between the bi-planar coils (Fig. 1B). Note that the direction of measuring magnetic fields was perpendicular to the scalp surface and control electronics were located outside the MSR so as to minimize the influence of unwanted electromagnetic interference on OPM-MEG measurement.
Three subjects (two males, one female) aged between 28 and 35 years old took part in this research. The protocol was approved by the Research Ethics Committee of Suzhou Hospital, Affiliated Hospital of Medical School, Nanjing University (approval number: IRB2023071). All the subjects were given informed consent and agreed to participate in the study.
A series of tasks were devised to demonstrate field nulling stability and its robustness to subject motion. Four sensors were placed on each side of the left and right temporal lobes of the plastic head model in the MSR. A continuous 120 s measurement was obtained with the nulling system inactivated. Then the static magnetic field of the head model was measured for 20 min with the nulling system activated. Subsequently, the subject sat in the MSR and was requested to remain motionless while a continuous measurement of 120 s was obtained with and then without field nulling. A similar continuous measurement of 120 s was also obtained with and without fields nulling while the subject made continuous head movements in the volume of a 30 cm cube.
To conduct the AEFs measurement, a MEG compatible auditory stimulator was developed where sound traveled to the subject through a rubber tube and disposable earpieces. The time error between the sound and the stimulus marker was in the µs timescale, which had negligible effects for measurement of the AEF signal [31]. Specifically, a pure-tone auditory stimulus was presented to the subject’s left ear. It consisted of a series of standard 1 kHz tones (300 ms duration, 1700 ms inter-stimulus interval) randomly interleaved with rare 1.2 kHz tones (300 ms duration). A total of 300 trials were recorded and only those trials triggered by 1 kHz pure-tone auditory stimulus were analyzed (240 trials, accounting for 80 % of the total). The subject was not requested to respond but was required to focus on the sound during the measurement period inside MSR.
The auditory responses tests of the hybrid OPM-MEG/EEG systems were repeated with only nine OPM sensors and a 64-channel EEG system (BrainAmp MR, Brain Products GmbH, Gilching, Bavaria, Germany). The EEG cap was fitted to the subject’s head and the flexible OPM helmet which was put upon the cap attached with three OPM sensors located over the left auditory cortex, five sensors located over the right cortex and one sensor located at the region near the Cz electrode.
The OPM array was distributed over the auditory cortex of the temporal lobes of each of the two hemispheres of a subject’s head. The sample rate of OPM-MEG recording was 1024 Hz. Auditory stimuli were presented via an airline-type plastic headset to the left ear of the subject and temporal markers describing the onset of these stimuli were also recorded by the OPM-MEG system. Co-registration was performed instantly after the subject got ready to sit in the MSR. The shimming procedure was executed to allow the subject unconstrained performance during the experiment. Finally, OPM-MEG data collection was initiated. To enable a comparison, auditory experiments were repeated using nine OPM sensors and a 64-channel EEG system in the same MSR under the OPM-MEG/EEG hybrid measurement and EEG data were measured at a sample rate of 5000 Hz.
The normative co-registration approach used in the traditional SQUID-MEG system is based on head position indicator coils attached to the subject’s head in conjunction with a pen-like electromagnetic 3D digitizer [1, 2, 3]. This process was conducted by aligning the digitized anatomical landmarks in the head position coil location coordinates with the same landmarks in the MR image [3]. Simultaneously, subjects were told to avoid excessive head movement. The co-registration procedure of OPM-MEG employed here, however, differs from that of SQUID-MEG due to the flexible helmet configuration and unrestricted movement of subjects.
Specifically, the co-registration procedure employed a commercial electromagnetic 3D digitizer (Fastrak Digitizer, Polhemus Inc., Colchester, VT, USA) with a reference micro sensor (Fastrak 3A0878-180, Polhemus Inc., Colchester, VT, USA). The electromagnetic digitization system was used to digitize the positions of spots in space. The reference micro sensor was attached firmly on the subject’s head with skin tape and provided the locations and Euler positions synchronized with the electromagnetic 3D digitizer.
In the preparation phase before MEG measurement, the subject sat in the MSR wearing the flexible helmet with each OPM sensor inserted into the sensor holder. The 3D digitizer firstly digitized anatomical landmarks (the nasion and the two preauricular points, red circles in Fig. 2A) and then all four dots (blue circles in Fig. 2A) on each sensor holder. The set of dots for each sensor were further calculated to determine both the OPM location and orientation, as shown by the blue circles and red arrows in Fig. 2B, respectively. These OPM positions were subsequently aligned with the above-mentioned anatomical landmarks into MEG-head coordinates (Fig. 2B). With the help of MR image segmentation (Fig. 2C) by the Fieldtrip toolbox (Donders Institute for Brain, Cognition and Behaviour, Radboud University, Nijmegen, the Netherlands; http://fieldtriptoolbox.org), the MEG-head coordinate was finally transformed into the MRI coordinate system via the anatomical landmarks. The co-registration result is shown in Fig. 2D.
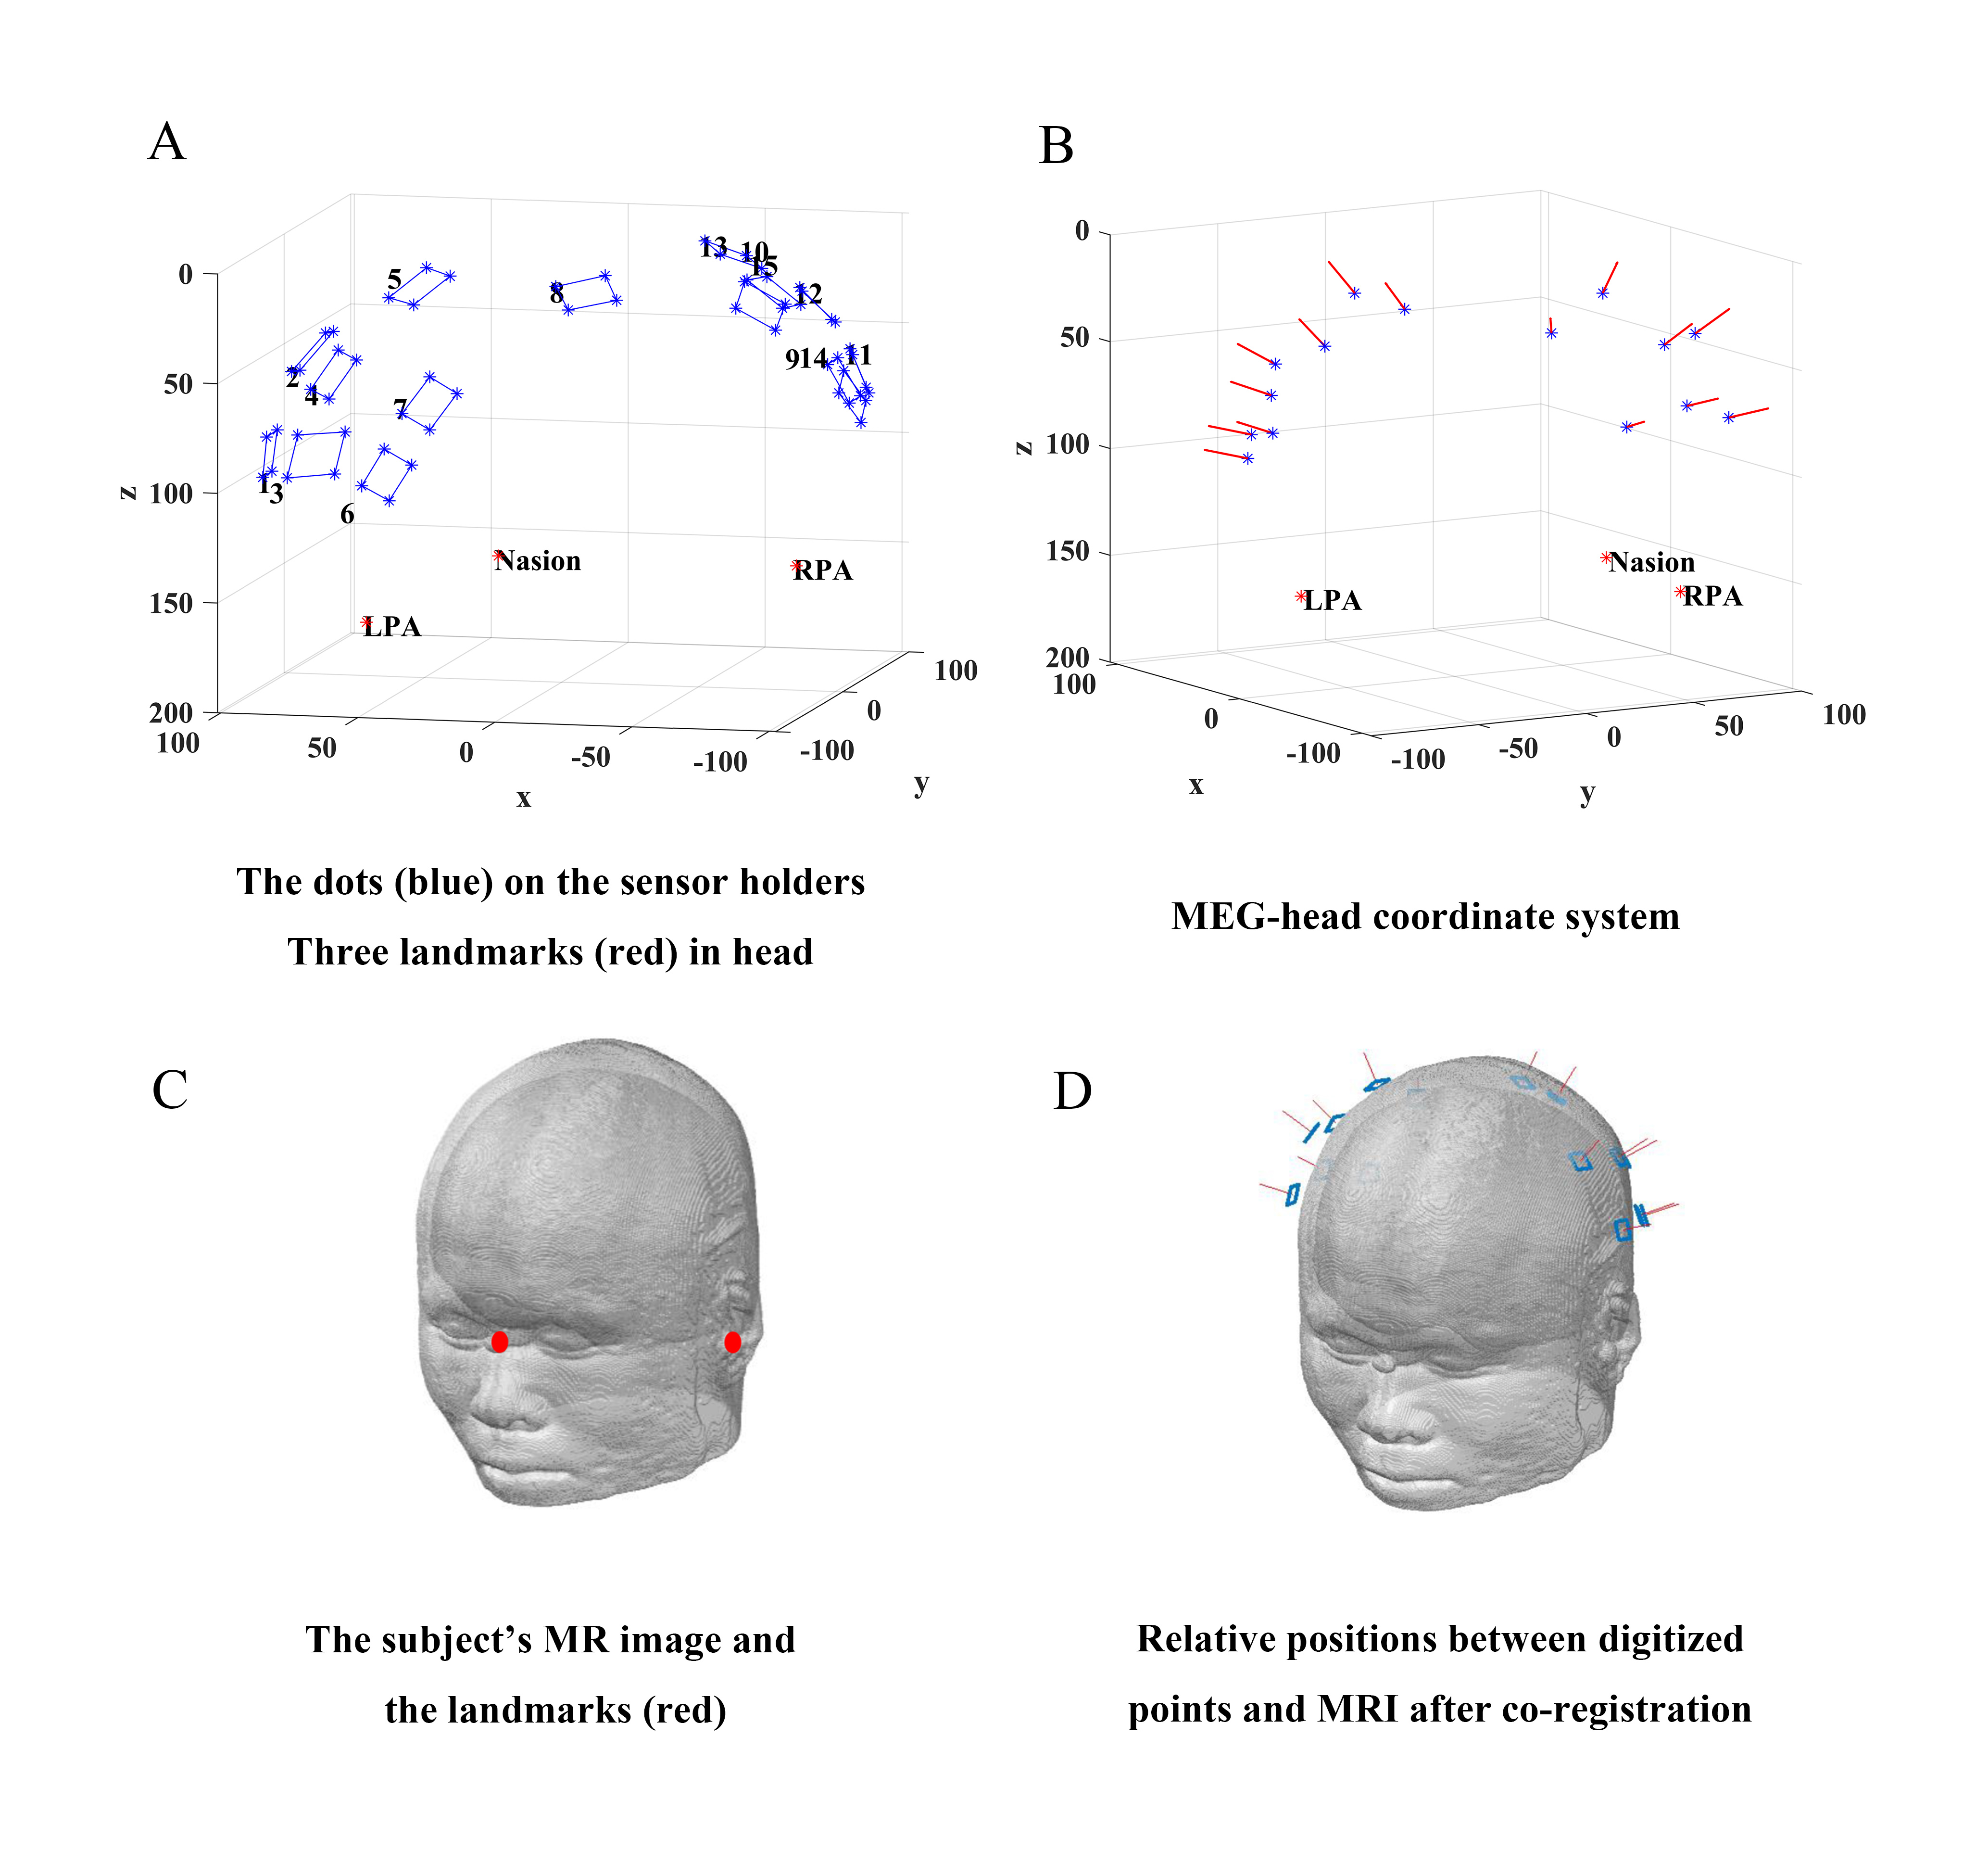 Fig. 2.
Schematic diagram of co-registration procedure based on the flexible helmet. (A) Digitization of landmarks of head (red) and dots on sensor holder (blue). (B) The central position (blue) and orientation (red arrow) of each sensor were determined according to internal structure of the OPM and the surface plane of the corresponding sensor holder. (C) Segmentation of MR image. (D) A transformation to the MRI coordinate system. MRI, magnetic resonance imaging; LPA, left pre-auricular point; RPA, right pre-auricular point; MR, magnetic resonance.
Note that the positioning error caused by subject movements during the whole digitization process is finally corrected by Euler angles recorded by the reference micro sensor, which is affixed to the subject’s head for synchronously tracking potential head movements.
All signal processing and analysis were performed with MATLAB (R2018b, MathWorks, Inc., Natick, MA, USA).
Initially, raw MEG data were filtered via a band pass, zero phase filter with a
range of 0.3–100 Hz so as to include the required AEF frequency bands. A mains
power notch filter at 50 Hz was then applied. Moreover, the band-stop filter at
70 Hz (
Additionally, the power spectral density (PSD) of the filtered signal was
utilized for excluding imperfect channels due to system malfunction or
poor-quality data since the PSD (frequency range
After preprocessing, continuous data were segmented into epochs of 600 ms
duration consisting of a 100-ms pre-stimulus baseline interval. A baseline
correction algorithm used this time window prior to stimulus application on each
trial (baseline calculated over the –100 ms
Depending on signal amplitude thresholds for each channel and visual inspection, ‘bad’ epochs were removed. Residual trials were then averaged relative to the stimulus onset trigger.
The open-source software EEGLAB (Swartz Center for Computational Neuroscience, La Jolla, CA, USA; http://www.sccn.ucsd.edu/eeglab/) in MATLAB was used for EEG preprocessing. EEG data were re-reference (using TP9 and TP10 electrodes) and resampled at 1024 Hz. A band-pass filer in the range of 0.1–100 Hz was then applied to EEG data. Similarly to the MEG data, 600 ms epochs were then created. After undergoing independent component analysis, eye blink artifacts were manually removed [21, 32, 33].
The measured field of the plastic head model in the MSR for a recording of 20
min with field nulling switched on is plotted as a function of time in Fig. 3A.
Results show that the average (over all eight sensors) of the standard deviation
is –0.06
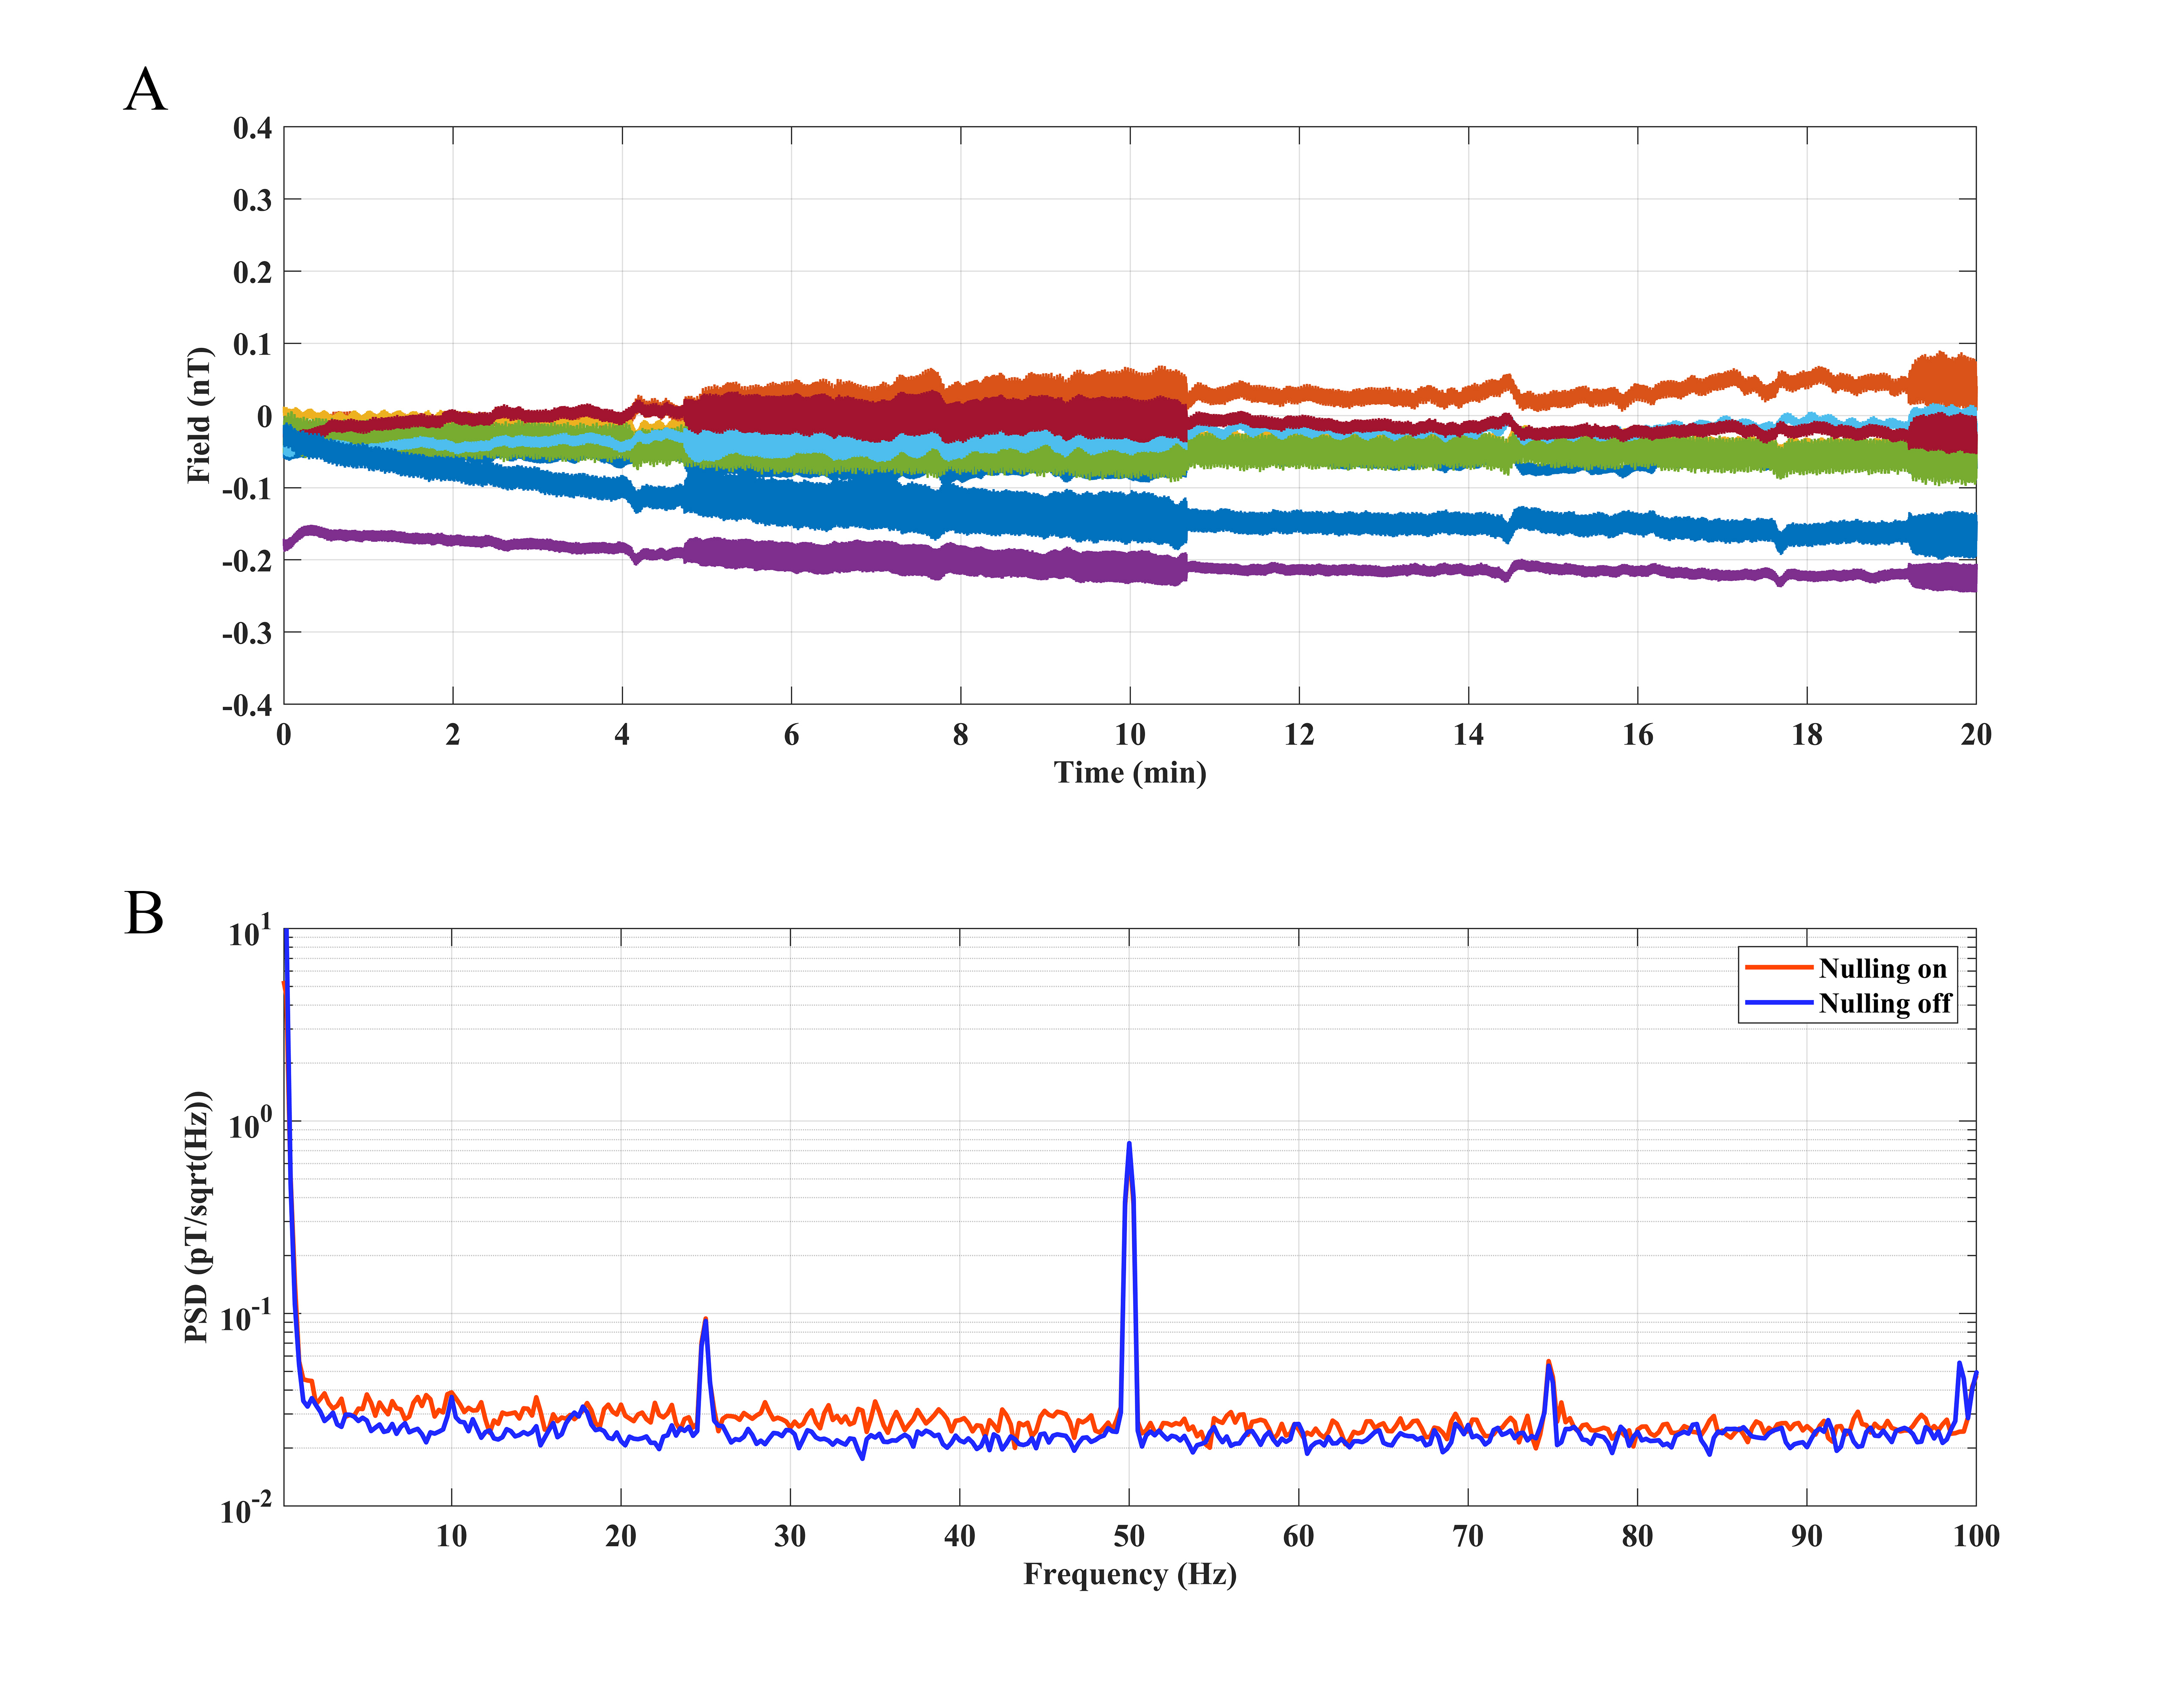 Fig. 3.
OPM signal analysis of a stable plastic head model in the MSR with and without field nulling. (A) Static field measured by an array of eight OPM sensors for a 20 min recording with field nulling on. (B) PSD of a single OPM recorded with field nulling on and off. MSR, magnetically shielded room; PSD, power spectral density.
Fig. 4A shows the output of all eight sensors in the time domain with and without field nulling while the subject tried to remain motionless. The result is similar to that shown in Fig. 3A. The PSD analysis of the signal (one single OPM in Fig. 4A) in Fig. 4B shows that the low-frequency interference caused by the participant (a person’s body is impossible to remain completely motionless during the measurement) is reduced with field nulling on.
 Fig. 4.
OPM signal analysis in the presence and absence of field nulling while a subject either remained motionless or made head movements. (A,B) Analysis of field (of eight OPMs) and the PSD (of a single OPM) with the field nulling on or off while the subject was motionless. (C,D) Analysis of field (of eight OPMs) and the PSD (of a single OPM) with field nulling either on or off while the subject made continuous head movements within the 30 cm cube volume.
Fig. 4C,D show the output of OPM sensors as a subject moved their head randomly.
Fig. 4C shows that the MEG signal will remain in the range of
Evoked response to the auditory stimuli for a subject’s left ear is depicted in Fig. 5 where each waveform was an average of about 240 stimuli. The strongest AEFs were acquired from sensors located around the auditory cortex, i.e., channel three and thirteen as indicated in Fig. 5A. It is evident that the M100 is a prominent deflection at ~100 ms postonset and its amplitude is larger in the hemisphere contralateral to the stimulated ear, which is similar to previous studies that showed contralateral hemispheric dominancy in the AEFs for stimuli [34, 35].
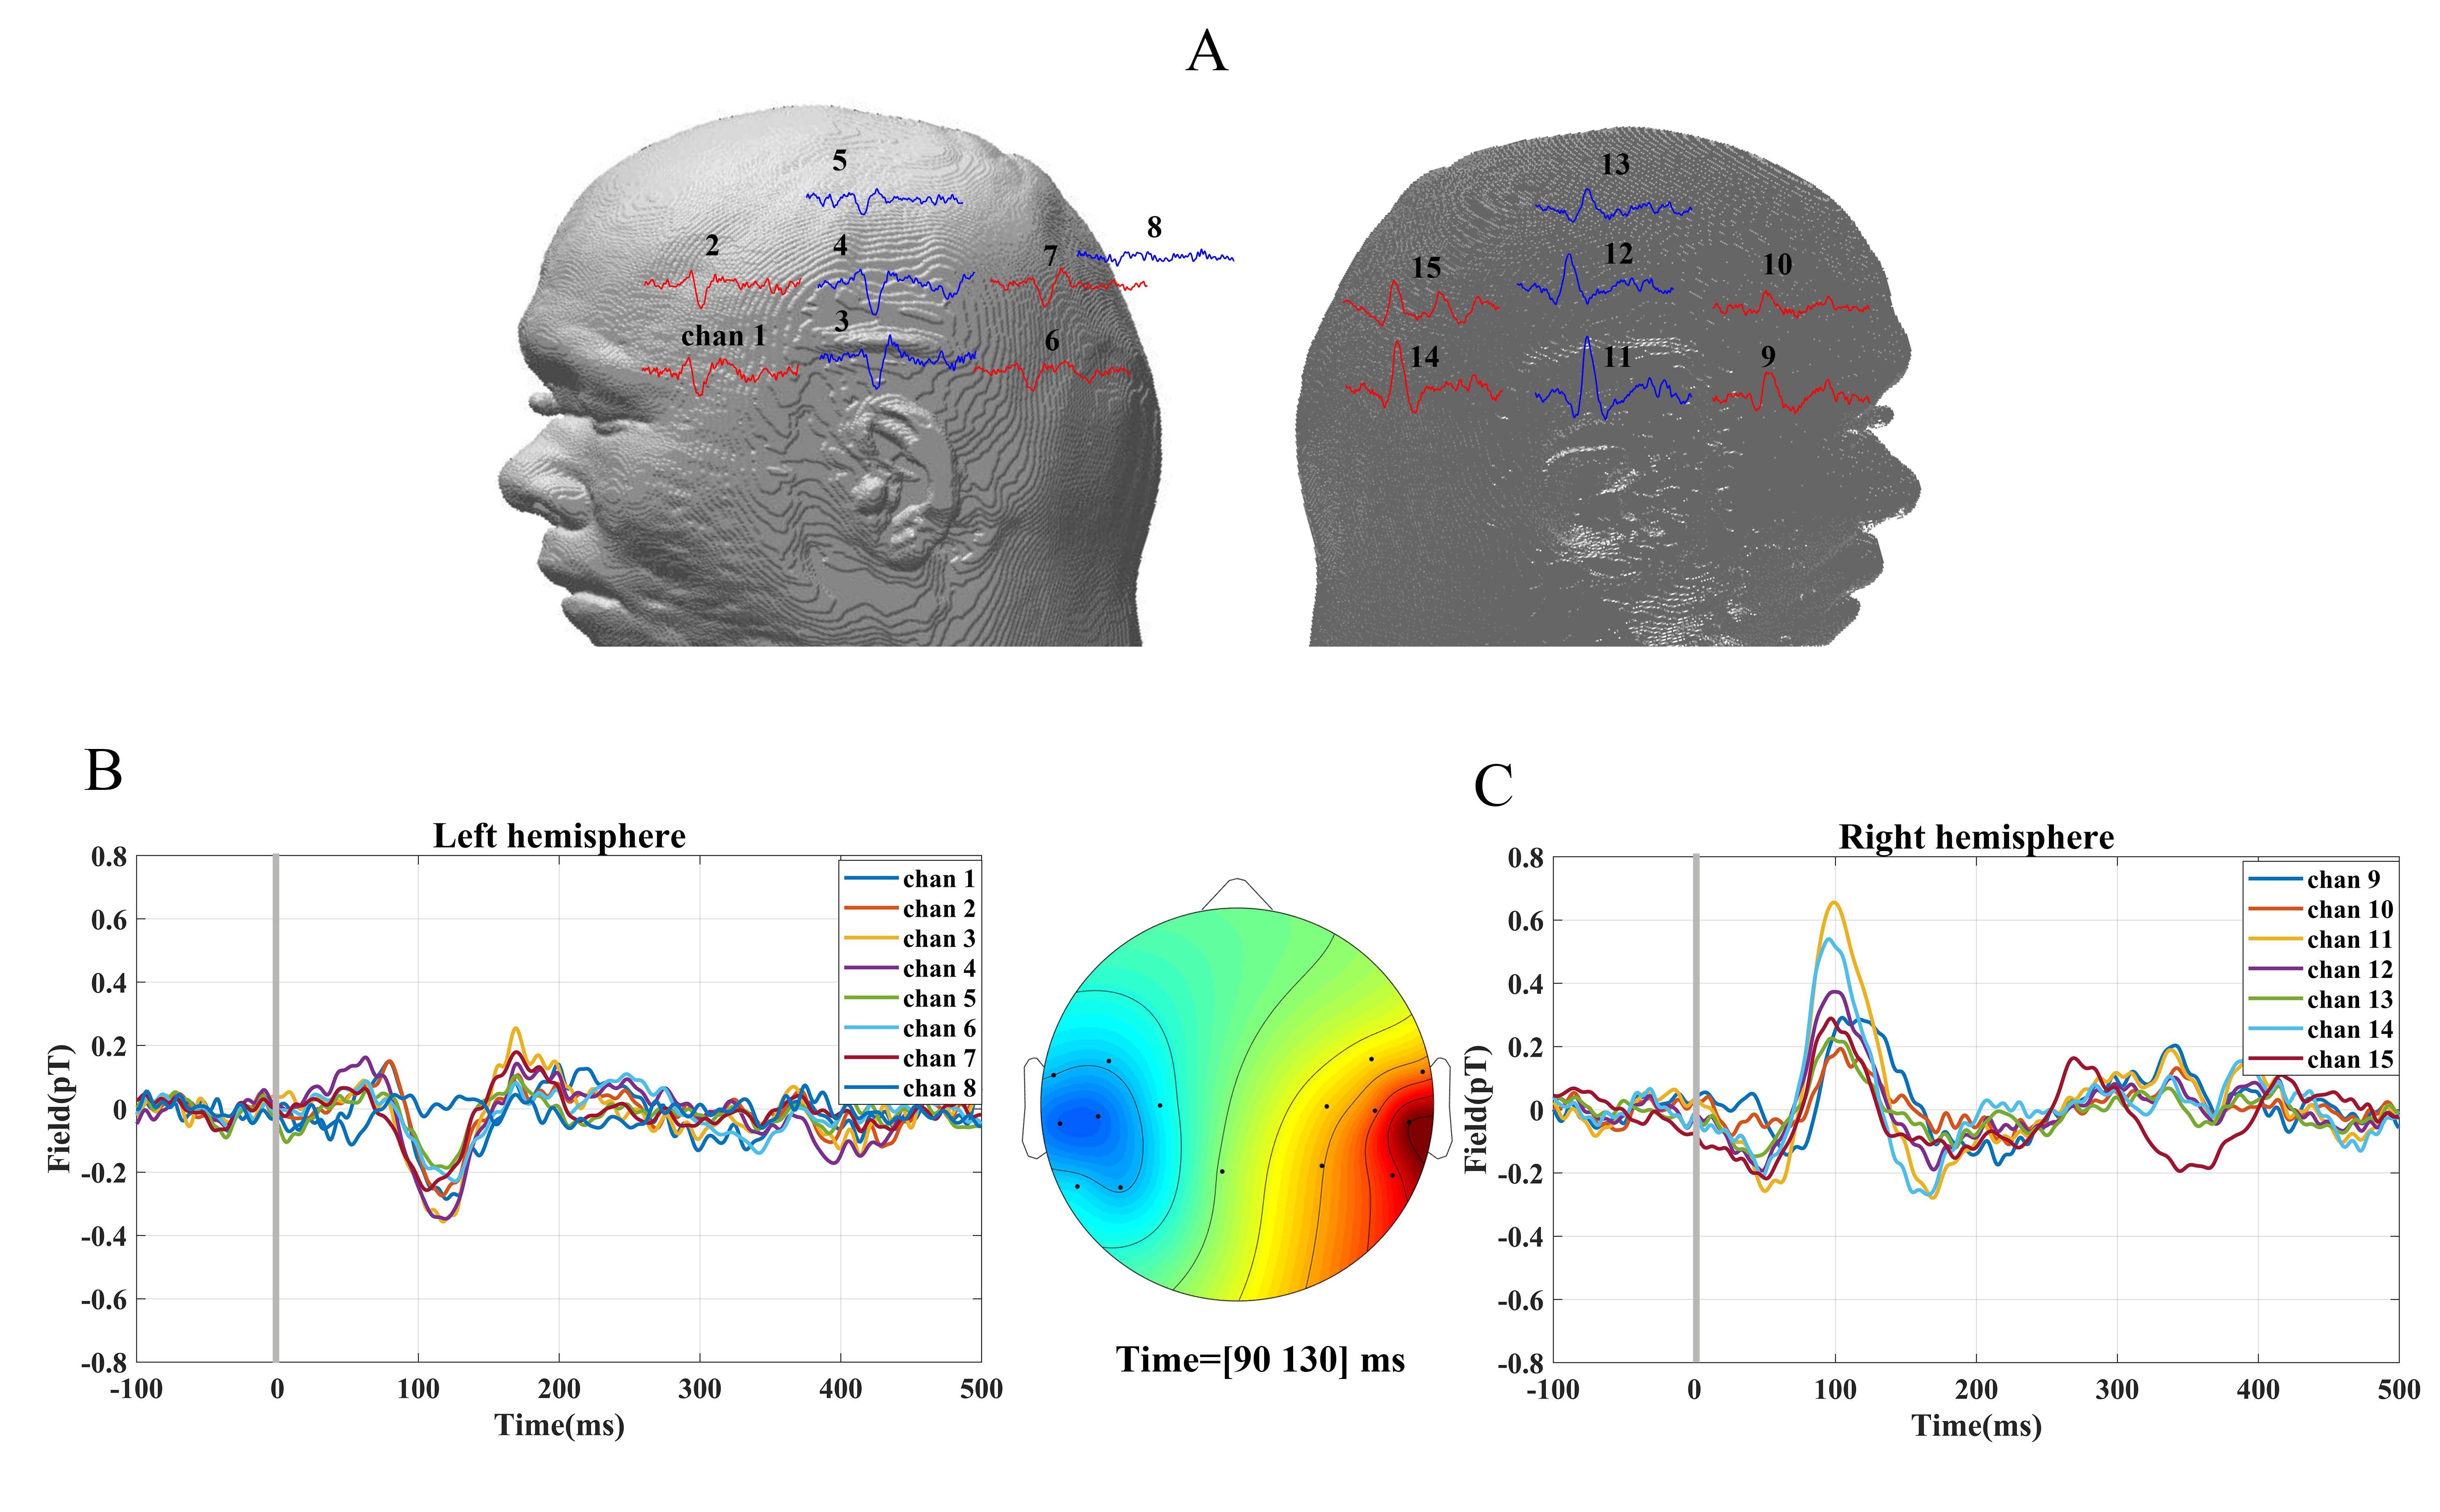 Fig. 5.
Time-locked data for auditory evoked responses. Each waveform was an average of 240, 1000 Hz pure-tone auditory evoked stimuli presented at t = 0, as indicated by the vertical line, and lasting 300 ms over the left ear. (A) The clear M100 evoked responses for one subject were detected from the sensors located over both hemispheres. (B) Auditory evoked response fields (AEFs) detected from the left hemisphere. (C) AEFs detected from the right hemisphere. The sensor topology around the M100 latency (amplitude average between 90 ms and 130 ms).
The averaged waveforms of the three subjects (two males, one female) are shown in Fig. 6. The middle latency auditory evoked field (M50) and long latency auditory evoked field (M100) occurred around 50 ms and 100 ms, respectively, after stimulus onset.
 Fig. 6.
Auditory evoked responses recorded for three human subjects with sensor arrays placed at the two sides of the hemispheres. (A) AEFs detected from the left hemispheres. (B) AEFs detected from the right hemisphere. AEFs, auditory evoked response fields.
The influence of sensor coverage, the stimulus frequency and the interference caused by auditory devices to AEF experiment have been excluded and the waveform of the results are similar among different people which suggests that the collected MEG signal is evoked by auditory stimulus. From Figs. 5,6, the amplitude of the M100 at the left hemisphere was always negative while it was positive at the right hemisphere when the auditory stimulus was 1 kHz and presented at the subject’s left ear, which is different from the responses detected by the EEG system. Given the M100 response was attributed to a current source localized to the upper banks of the superior temporal gyrus in both hemispheres and the results in Figs. 5,6, the responses from auditory cortex across the two hemispheres typically are characterized by a source/sink pairs which are antisymmetric [36, 37, 38, 39].
It has previously been reported that MEG source reconstruction inclines toward being more accurate within the non-invasive brain imaging techniques because MEG signals are fundamentally the same as the signals recorded from the exposed brain surface [34]. After co-registration of MRI and MEG data (finding the relative positions of brain anatomy and sensors), the first step in source localization as described in section 2.3, the LCMV was applied to localize neuronal current sources activated for the M100 peak of AEF data. The Fieldtrip toolbox [21] was used to implement the dipole fitting routine and the linear LCMV and grid-scanning procedure was performed at a resolution of 5 mm.
From Fig. 7, it was found that the response strength of AEFs recorded by this OPM-MEG system was concentrated in the area near the primary auditory cortex of the temporal lobe. The AEF source localization in three different adult subjects using the OPM-based MEG system were at (13, –70, 64), (42, –67, 66), (23, –62, 58) (the unit is mm).
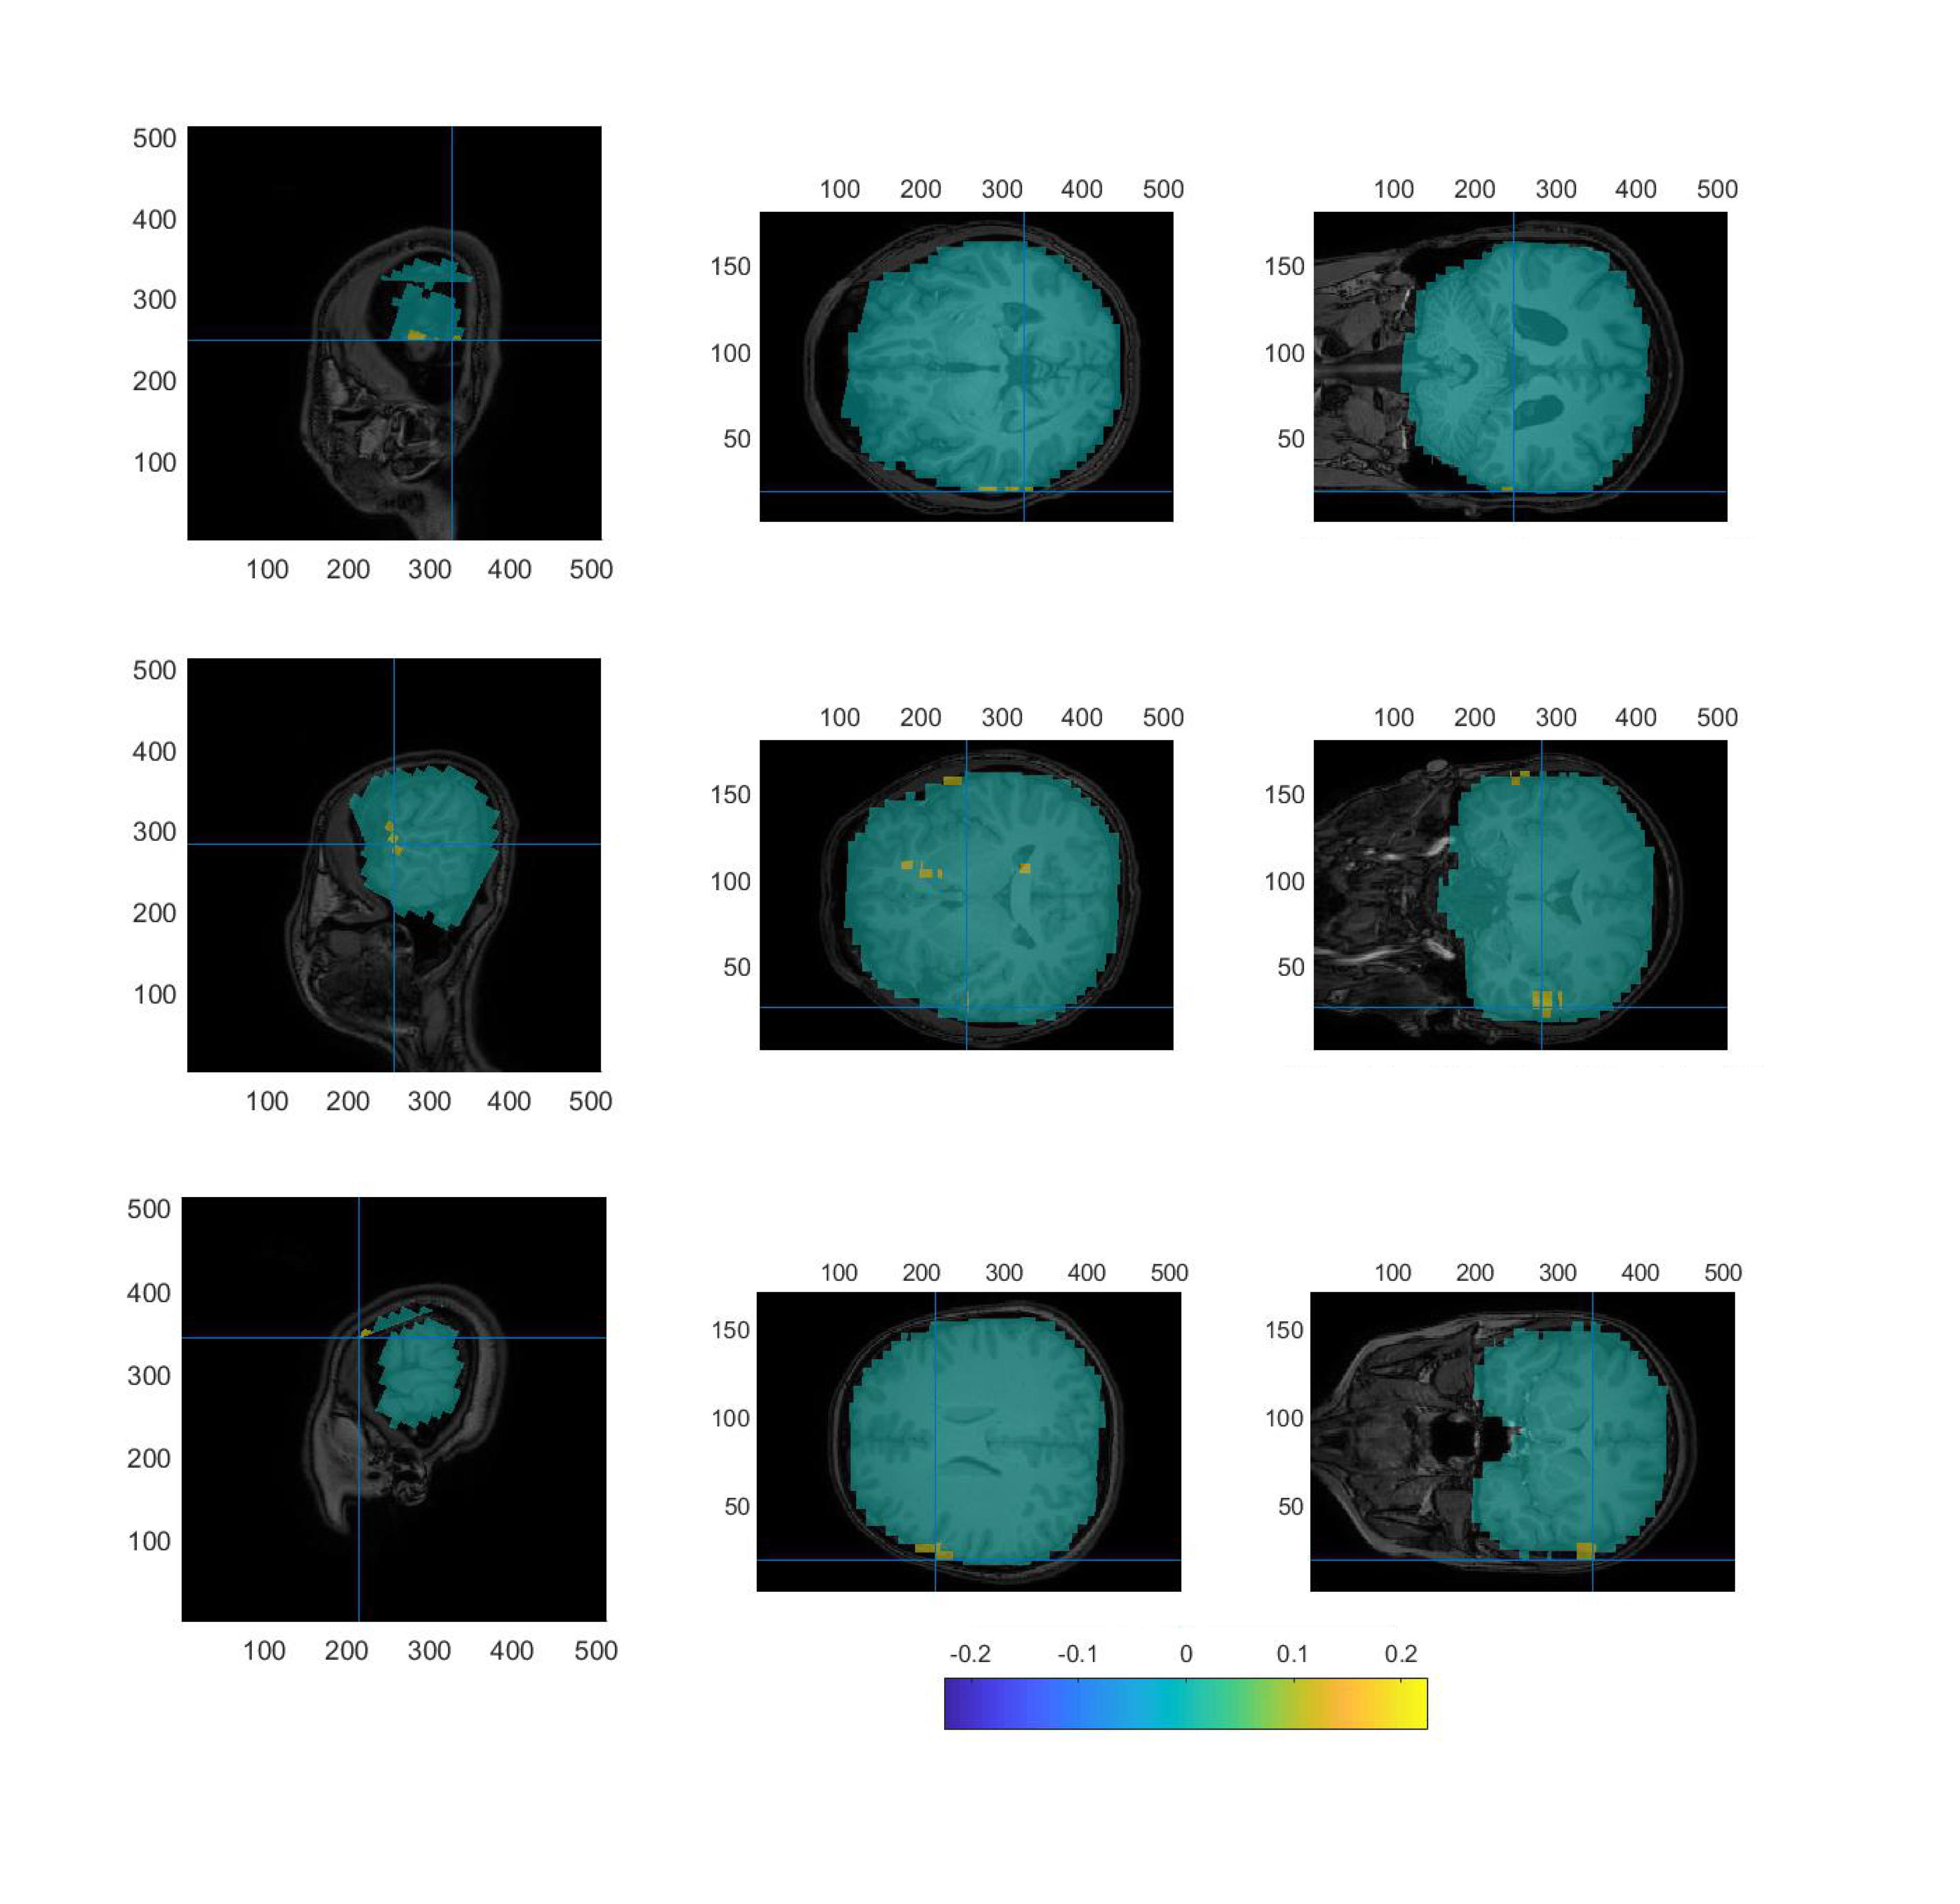 Fig. 7.
Localization using LCMV on the OPM-MEG data of three subjects: Sagittal (left column), Transverse (middle column) and Coronal (right column) planes of the M100 peak in AEF data. LCMV, linearly constrained minimum variance.
MEG and EEG data were recorded by an independent OPM-MEG system, an independent EEG system and a hybrid OPM-MEG/EEG system. Results of resting state experiments for 30 s are given in Fig. 8. Fig. 8A shows the PSD of the raw MEG signal (of a single OPM) recorded by OPM-MEG system alone and hybrid OPM-MEG/EEG system, and Fig. 8B shows the raw EEG signal (from electrode C5) recorded by EEG system alone and hybrid OPM-MEG/EEG system, respectively. It is clear that there is little difference between the spectra, suggesting that two modality do not affect each other.
 Fig. 8.
PSD analysis of MEG and EEG data of resting state subjects. (A) PSD of resting state OPM-MEG signal when collected alone (red) and concurrently with EEG (blue). (B) PSD of resting state EEG signal when collected alone (pink) and concurrently with OPMs (green). EEG, Electroencephalography; PSD, power spectral density.
The results of the auditory evoked responses of the hybrid OPM-MEG/EEG system are shown in Fig. 9. The PSD analysis of the MEG (of a single OPM) and EEG signal (from electrode C5) for 120 s, selected from the whole AEF experiment is shown. In Fig. 9A, the red trace gives the PSD of AEF MEG data without the EEG system in MSR and the blue trace shows the PSD of AEFs while EEG devices synchronously collected data. Likewise, in Fig. 9B, the pink trace shows EEG data without OPMs and the green trace shows the case with OPMs. The results are similar with those of the resting state and demonstrates the feasibility of the hybrid system for the acquisition of auditory evoked responses.
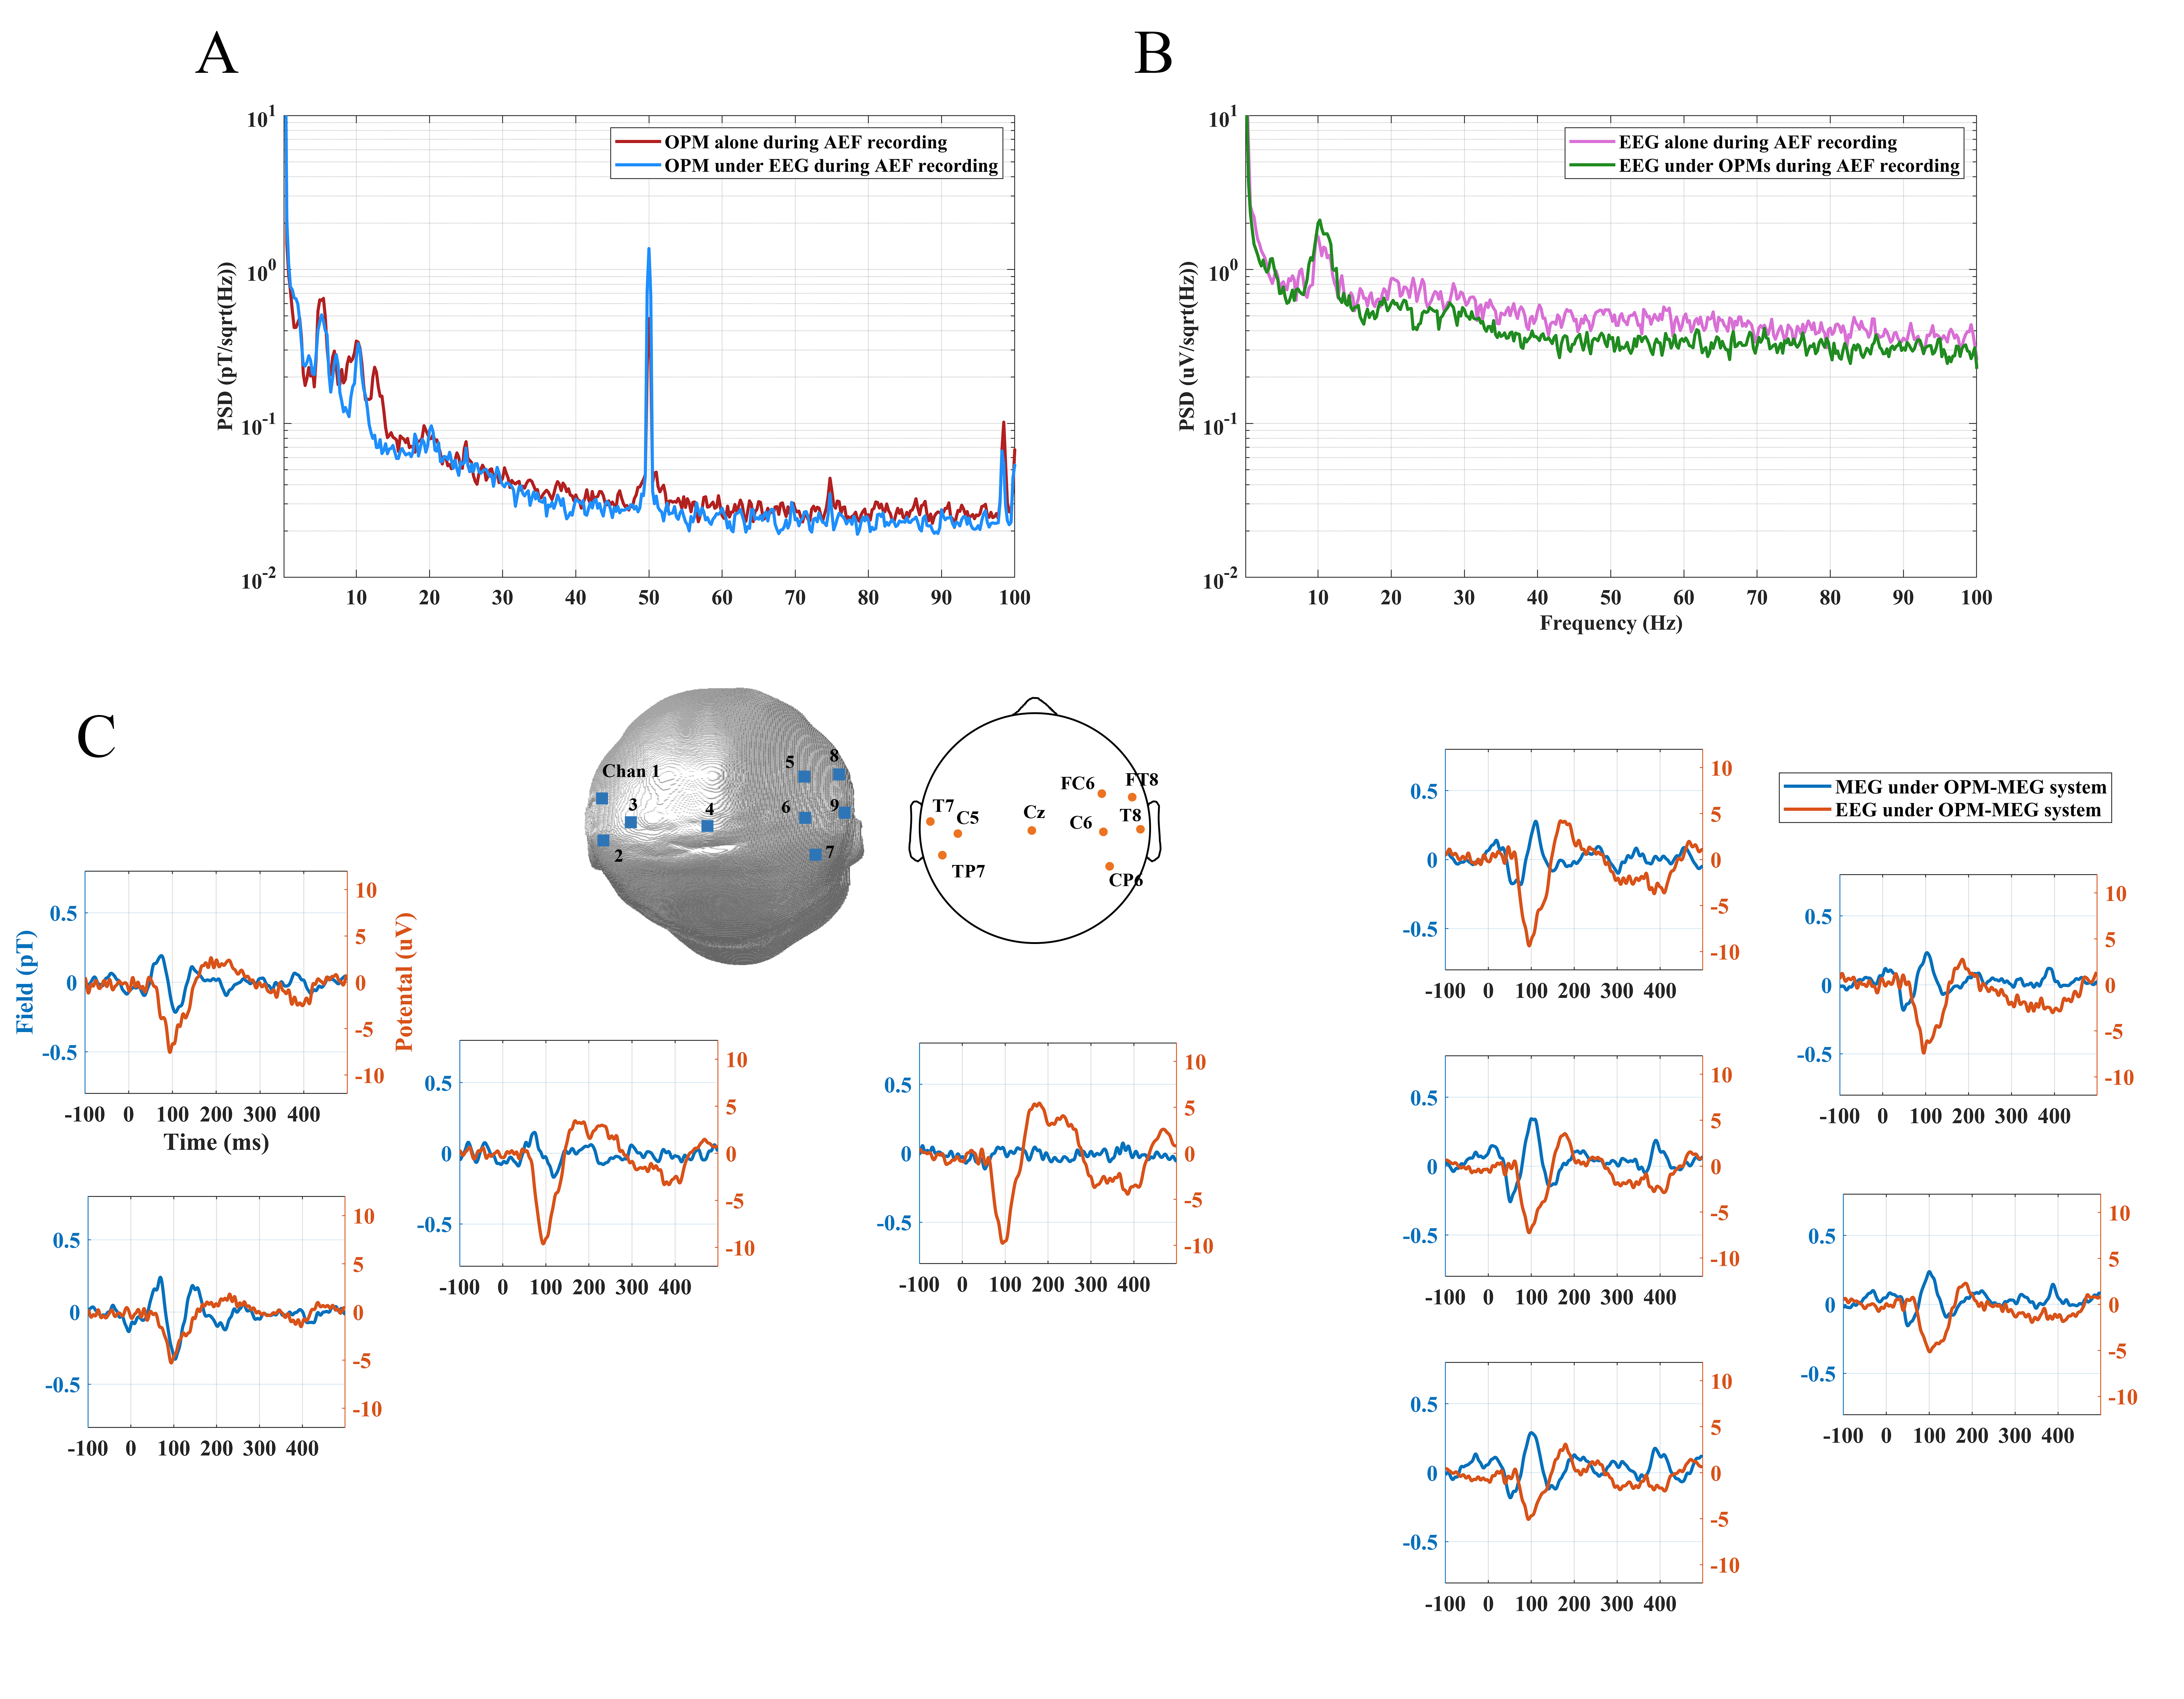 Fig. 9.
The analysis of MEG and EEG data in auditory evoked tasks. (A) PSD of OPM-MEG signal when collected alone (red) and concurrently with the EEG (blue). (B) PSD of EEG signal when collected alone (pink) and concurrently with the OPMs (green). (C) Auditory evoked responses recorded by the hybrid OPM-MEG/EEG system.
The head shape in Fig. 9C shows the spatial distribution of the OPM-MEG sensors and the EEG electrodes in the hybrid system. MEG AEFs (blue traces) and EEG auditory evoked potentials (AEPs) (orange traces) both contained three peaks at M50, M100 and M150 after stimulation while the latency of the M100 in the EEG was shorter than that in MEG. The Fig. 9C shows that, whereas auditory evoked responses are observed in all nine EEG sensors, AEFs are observed only over left and right temporal lobe MEG sensors (no AEFs observed in midline central areas). It also shows that the AEFs was identified as a dipole-like pattern, i.e., a source (positive average amplitude)/sink (negative average amplitude) pair across the two hemispheres and EEG system had no this characteristic.
A 15-channel OPM-MEG system was constructed to achieve AEFs with identification of standard peaks inside a custom-built MSR with a set of planar coils. A flexible helmet together with a particular co-registration process was developed to minimize the sensor-to-head distance and expand the applicable study population. Meanwhile, a hybrid OPM-MEG/EEG system was constructed to detect auditory evoked responses to verify the feasibility of the hybrid system for synchronous MEG and EEG signal acquisition.
Results show the stability and effectiveness of the field nulling system in the case of head movements in the volume of a 30 cm cube. The field nulling is sufficiently stable over the duration of our experiments and participant could make head movements when the field nulling system is in operation without saturation of the sensor output. Further optimization of the field nulling system should be undertaken to obtain a larger region over which homogeneous fields and field gradients are produced and allow ambulatory motion tasks, extending to even roaming freely and social interaction. The bi-planar coils used were constructed by time consuming manual winding of the wires following a printed pattern. 3D-print techniques could possibly be applied to simplify coil construction and to reduce errors in the theoretical design of coils and their and actual layout [25].
Considering that vigorous movement may still cause sensors to exceed their dynamic range, the four OPM sensors used in field nulling could be configured as references in a virtual gradiometer-based method to reduce motion noise. With this method, there is no requirement for the number of detection sensors while no prior sensor information is needed.
OPM sensors were set on the scalp regions near the location of the auditory cortex of the left and right hemispheres and the auditory evoked response of OPM-MEG signals were measured from three subjects. The subjects showed the same sink–source configuration which is consistent with the orientation of neurons in the auditory cortex and the magnetic field pattern produced by auditory cortex neural activity. Note that not only a wearable device was developed that allows slight subject head movement during measurements, but also that the specific co-registration process described here encouraged subjects to move freely which further provides preliminary preparations for the collection of the MEG signals of motor tasks.
The design of the flexible helmet is generic, fitting multiple individuals and is adjustable for different head sizes. As the flexible cap places the sensor array closer to the head, by consequence of the inverse square relationship between magnetic field and distance from the source, it can pick up higher quality and larger MEG signals than the traditional rigid helmet. Thus, it is possible to record the MEG signal throughout an entire life via this system, from birth to the elderly.
Previous publications have shown that MEG is well suited for studies of the auditory cortex [40, 41]. Here, AEFs were recorded from three subjects by an OPM-MEG system. Obvious M100 responses were detected by all channels of the sensor array and the M100 source was located in the area near the region of the auditory cortex. Results of source localization are not very clear in the case of a small number of sensors and single direction of magnetic fields, where measuring only the magnetic fields of 15 OPM sensors whose direction were perpendicular to the scalp surface were used for source localization. Considering that the OPM can make simultaneous measurements of all three orthogonal components of vector fields, detection of triaxial magnetic fields will obtain more neuro information and achieve higher source localization accuracy using fewer sensors [42] and realize whole-head coverage.
The hybrid-model system that combines OPM sensors and EEG electrodes has been constructed and the performance of compatibility and auditory response tasks have been assessed.
From Figs. 8,9, the commercial OPMs and EEG can performance well in the hybrid system with no appreciable loss of data quality in either modality since the EEG electrodes have no influence on the collection of magnetic fields by OPMs. The simple setup of the hybrid system where the flexible helmet is put over the EEG cap is easily constructed. As it is known that a magnetic field is sensitive to a tangential projection of an electric current, whereas the EEG is in principle sensitive to any electric charge or electric current in the source volume [1, 43, 44, 45] and owing to the EEG being considered to contribute to an estimated 5% of the extra-cranial measured magnetic field, some investigators believe that the EEG potential cannot be a fully accurate reflection of brain events [43], whereas combining EEG and OPM-MEG offers a wearable neuroimaging system that fully utilizes the advantages of both devices.
From the Fig. 9, the OPM-MEG signal has clear waveforms without the need for artifact removal. This means that although the MEG is recorded from the same signal sources as the EEG, MEG has an advantage in recognition of evoked response fields (ERFs) over EEG due to its anti-interference characteristics [43].
Thus, considering that subject movement is inevitable during the measurement of magnetic fields or electrical potential, with muscle artefacts being a non-negligible problem that reduces the quality of EEG data greater than the 20 Hz frequency band [1], fortunately, the major advantage of OPM-MEG reported here is that subjects can move during recording when a set of bi-planar coils and other devices are employed.
From auditory ERPs in Fig. 9, the evaluation of left and right ERP auditory components via MEG is easier than via EEG since compared with EEG (electric source and sink fields for left and right superimposed at midline EEG sites), the orientation of the left and right auditory neural generators is characterized with ease by MEG (magnetic source and sink fields distinct over left and right hemisphere and thus easily distinct field patterns for left and right activity) [36]. MEG can easily distinguish the left and right auditory cortex activity and EEG failed to detect this differences. These results indicate the hybrid OPM-MEG/EEG system would offer superior neural estimates for auditory related responses.
Due to the lack of portability and higher costs, SQUID-MEG is not widely used by brain–computer interfaces compared with EEG. The step of demonstrating and testing robust single-trial decoding of an OPM-MEG system in the control of a real-time ‘mind-spelling’ application has been taken [46]. The single-trial evoked response of a 24-channel OPM-MEG system has been recorded and its performance quantified [28]. Meanwhile it has been reported that an OPM-MEG system makes single trial observations of MEG signals possible [47] as the signal is more accurate with higher quality and lower signal-to-noise ratio (SNR). Given its high spatiotemporal resolution, integration of wearable technology, low maintenance and low sensor weight, it is expected that OPM will become an important tool in the further development of brain-computer interface research.
In this study, a 15-channel OPM-based MEG system was developed and high quality recording of AEF data in the averaged evoked waveforms was achieved, while the source location of an AEF signal through its large amplitude 100 ms component was also estimated. The performance of a field nulling system for head movement was described along with a special design for OPM installation (a flexible helmet) and an accurate and simple co-registration technique. Further, a hybrid-model system combining OPM sensors and EEG electrodes was introduced to assess the signal quality during the joint measurement. The OPM-MEG system described here, with the features that the placement of OPM sensors can be adjusted for different head shapes and sizes with a flexible helmet and that high quality of MEG data is detected in the presence of a subject’s head movement, will not only expand the fields of application in MEG measurement, but also provide a reference for building a hybrid MEG/EEG system.
MEG, Magnetoencephalography; OPM, Optically Pumped Magnetometer; SQUID, Superconducting Quantum Interference Device; MSR, Magnetically Shielded Room; AEF, Auditory Evoked Field; AEP, Auditory Evoked Potential; EEG, Electroencephalography; LCMV, Linearly Constrained Minimum Variance; MRI, Magnetic Resonance Imaging; fNIRS, Functional Near-infrared Spectroscopy.
The datasets used and analyzed during the current study are available from the corresponding author on reasonable request.
YC, HW and XZ proposed the experimental conception and specific concepts of the experiment. XYF put forward the design of the 3D-printed helmet. YZ and MKZ designed the auditory stimulus device. TH and XYF devised the bi-planar coils. ZKY, CQC, QQG, FYF, JYX and XZ carried out the experiment. YC and XZ analyzed the data. XZ drafted the manuscript. HQX provided advice on data analysis. XDY and JBZ provided critical revision of the manuscript for important intellectual content and offered constructive advice on the experiment. All authors contributed to editorial changes in the manuscript. All authors read and approved the final manuscript. All authors have participated sufficiently in the work and agreed to be accountable for all aspects of the work.
The protocol was approved by the Research Ethics Committee of Suzhou Hospital, Affiliated Hospital of Medical School, Nanjing University (approval number: IRB2023071). All the subjects were given informed consent and agreed to participate in the study.
Not applicable.
This research was funded by Ji Hua Laboratory (grant number X190131TD190); The Suzhou pilot project of basic research (grant number No. SJC2021024); The Natural Science Foundation of Shandong Province (grant number ZR2022QF098).
Tao Hu is a part-time employee of Jinan Guoke Medical Technology Development Co., Ltd.. The authors declare no conflict of interest.
Publisher’s Note: IMR Press stays neutral with regard to jurisdictional claims in published maps and institutional affiliations.